SigProfilerExtractor Output
This section goes over the different files that are generated when running SigProfilerExtractor. The example files throughout this section were generated from the Quick Start Example.
Output
The output directory results will contain subdirectories for each mutational context passed in as parameters, a JOB_METADATA.txt file, a Seeds.txt file, and an interactive reports.html file. Below is a preliminary view of the files that will be generated in results.

JOB_METADATA.txt
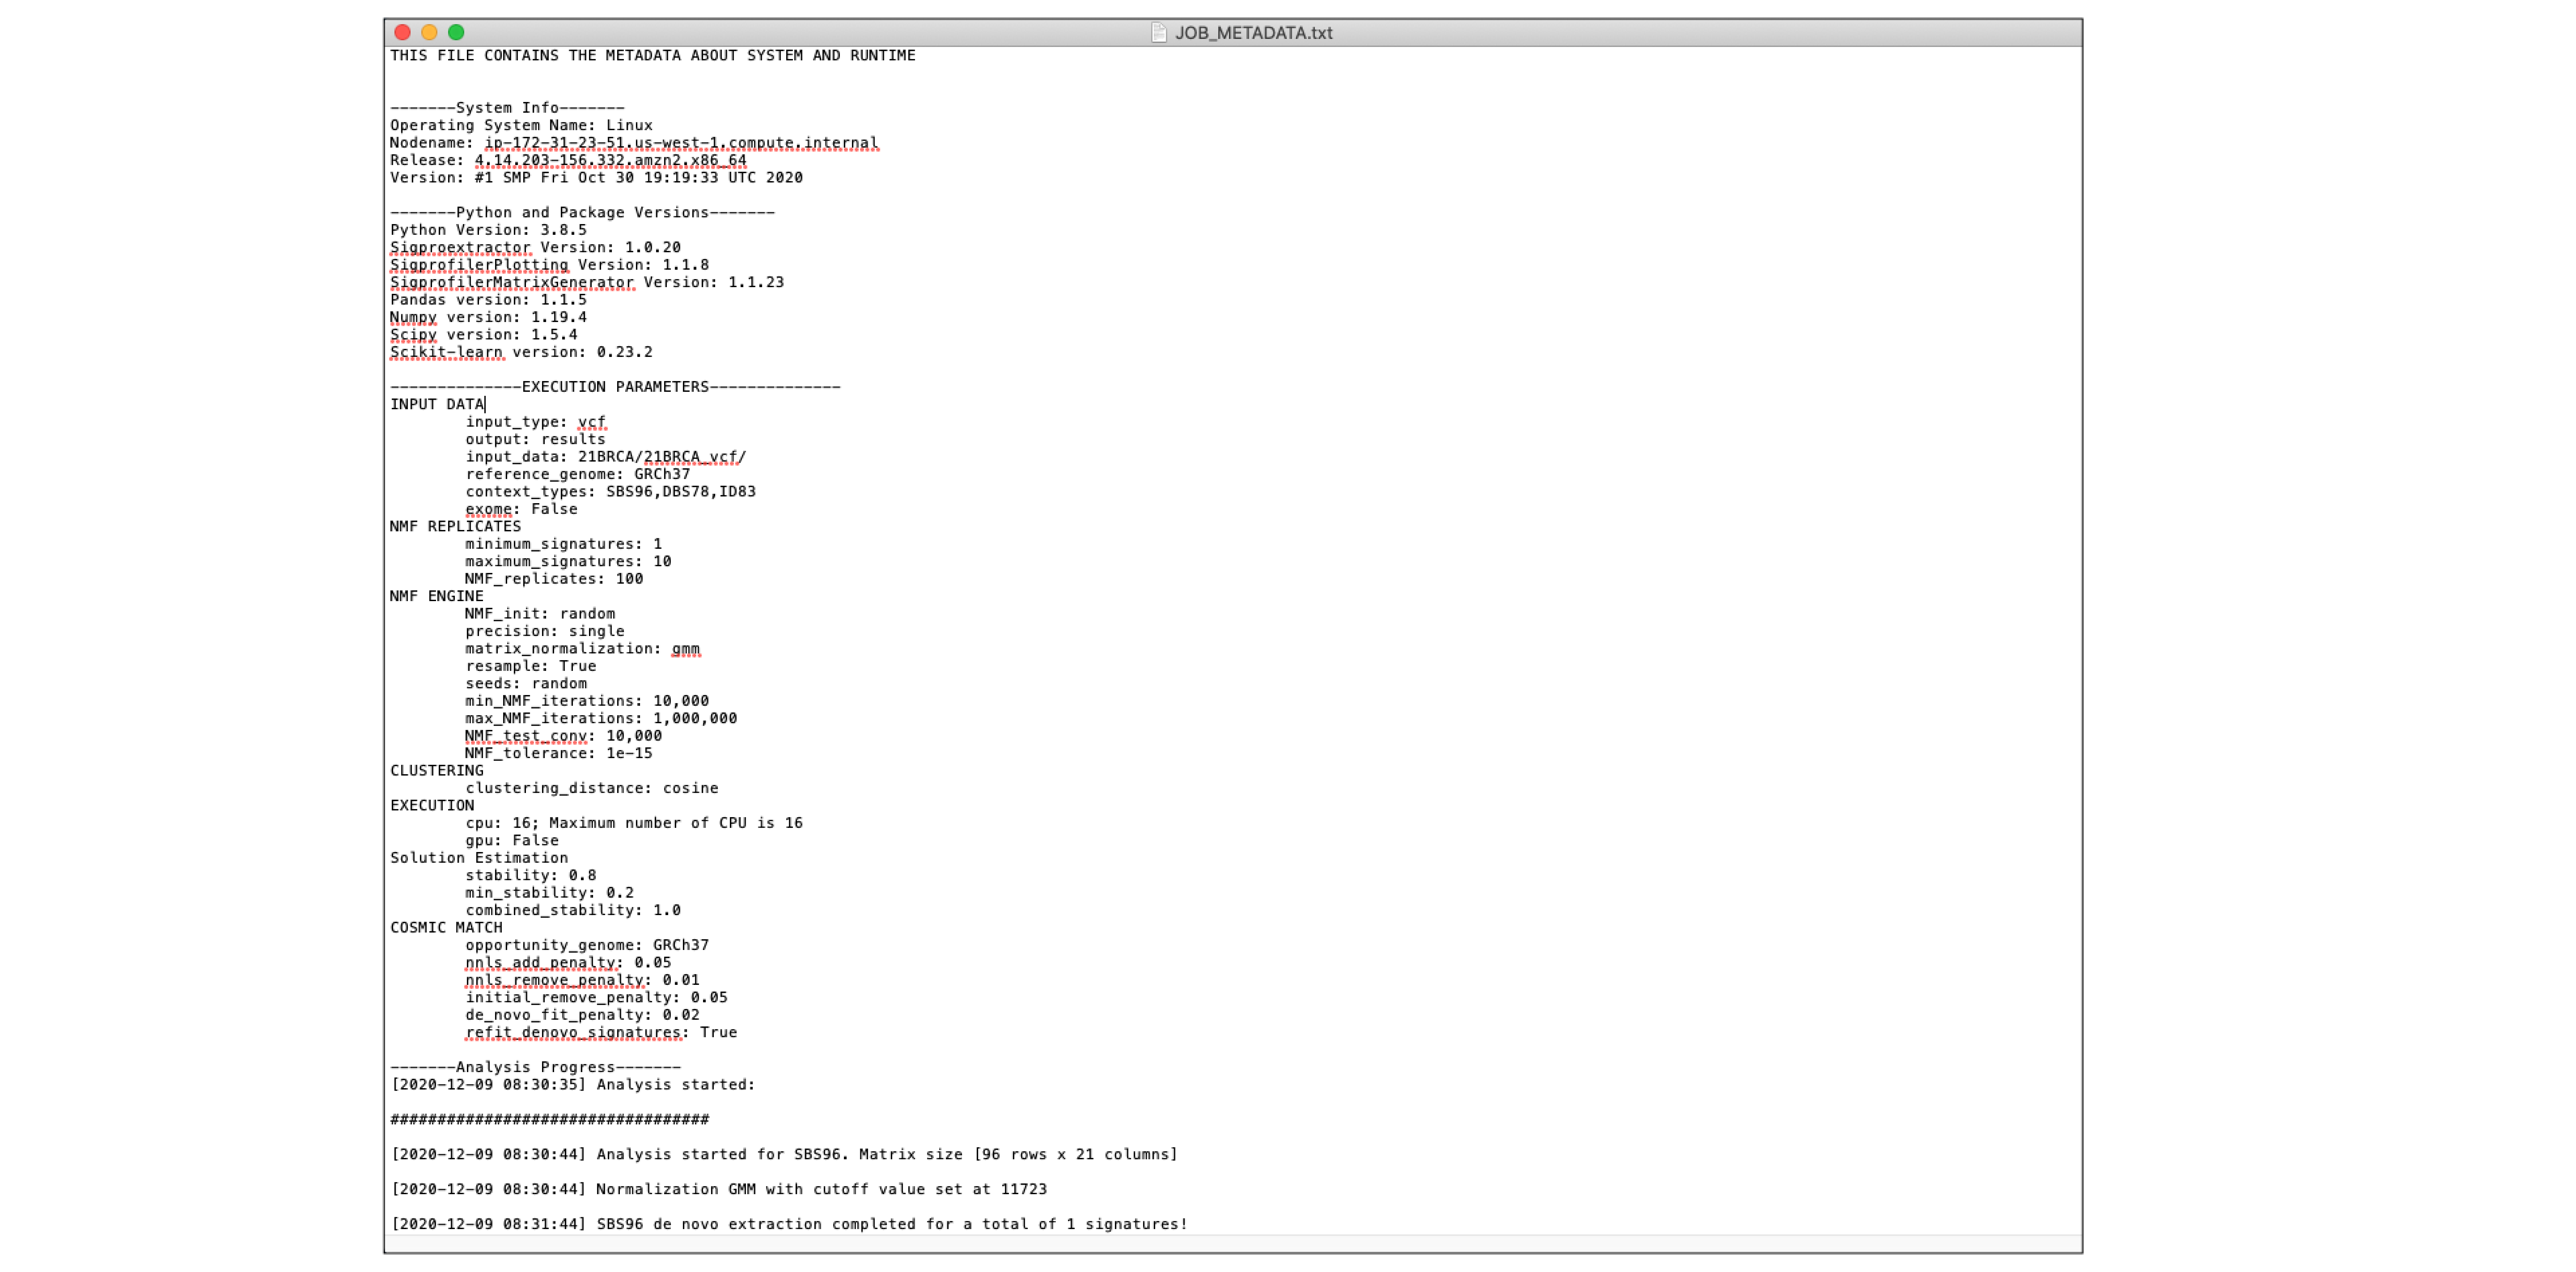
This file contains all the metadata about the system and runtime of the job.
The main sections of the file include the following: - System Info - Python and Package Versions - Execution Parameters - Analysis Progress - Job Status
Below is an example of what the metadata file contains.
Seeds.txt
Seeds.txt is a tab-separated file containing exactly one root seed in the Seed column. SigProfilerExtractor derives the random generators for all NMF replicates from this root seed. Pass this file through the seeds parameter to reproduce a run.
For example, the generated file has one data row. The first column is the
DataFrame index and the Seed column contains the root seed:
| Index | Seed |
|---|---|
| 0 | 278390142581741370537812005101985235401 |
reports.html
reports.html is a self-contained, offline dashboard generated after all requested mutation contexts and assignment steps complete. Double-click the file to open it in a modern browser; it does not start a server or send result data over the network.
The dashboard includes:
- overall rank-selection statistics, selected-rank evidence, and cohort mutation burdens;
- interactive signature profiles for every evaluated rank;
- selected de novo signatures and optional COSMIC decomposition results;
- stacked and heatmap views of signature activities, with sample ordering, percentage normalization, and optional log color;
- metric-selectable per-signature, per-sample, and NMF-replicate statistics; and
- run metadata and the exact reproducibility root seed.
Plots support hover, zoom, pan, reset, and SVG export. The information button beside each figure explains its axes, metrics, interpretation, and source data. Tables can be filtered, sorted by mouse or keyboard, and exported as CSV. Set make_dashboard=False (Python) or --make_dashboard false (CLI) to skip generation.
To create or refresh the dashboard for an existing completed output directory without rerunning extraction:
from SigProfilerExtractor.dashboard import create_dashboard

create_dashboard("results")
Mutational Context Subdirectory
For this section, the subdirectory SBS96 and its contents will be used as an example. Different mutational contexts will share the same file structure.
Each mutational context subdirectory (ex. SBS96, ID83, DBS78) contains the following files:
- All_solutions subdirectory
- Suggested_Solution subdirectory
- All_solutions_stat.csv
- SBS96_selection_plot.pdf
- Samples.txt
All_Solutions subdirectory
The All_Solutions subdirectory contains the results from running extractions at each rank within the range of the input. To learn more about the output found in All_Solutions, refer to the section Output - Suggested Solution.
Suggested_Solution subdirectory
The Suggested_Solution subdirectory contains the optimal solution. To learn more about the output found in the Suggested_Solution, refer to the section Output - Suggested Solution.
All_solutions_stat.csv
This file contains the record of the relative reconstruction error (the squared distance between the original data
and its “estimate”) and process stability.
This file contains columns with the following values for each signature identified from the input samples:
- Stability (calculated average silhouette coefficient)
- Minimum Stability
- Considerable Solution
- P-value
- Matrix Frobenius %
- Mean sample L1% (calculated as the sum of the absolute values of the vector) %
- Maximum sample L1%
- Mean sample L2% (calculated as the square root of the sum of the squared vector values) %
- Maximum sample L2%
- Mean sample KL (Kullback-Leibler divergence)
- Maximum sample KL
- Mean Cosine Distance
- Max Cosine Distance
- Mean Correlation
- Minimum Correlation

SBS96_selection_plot.pdf
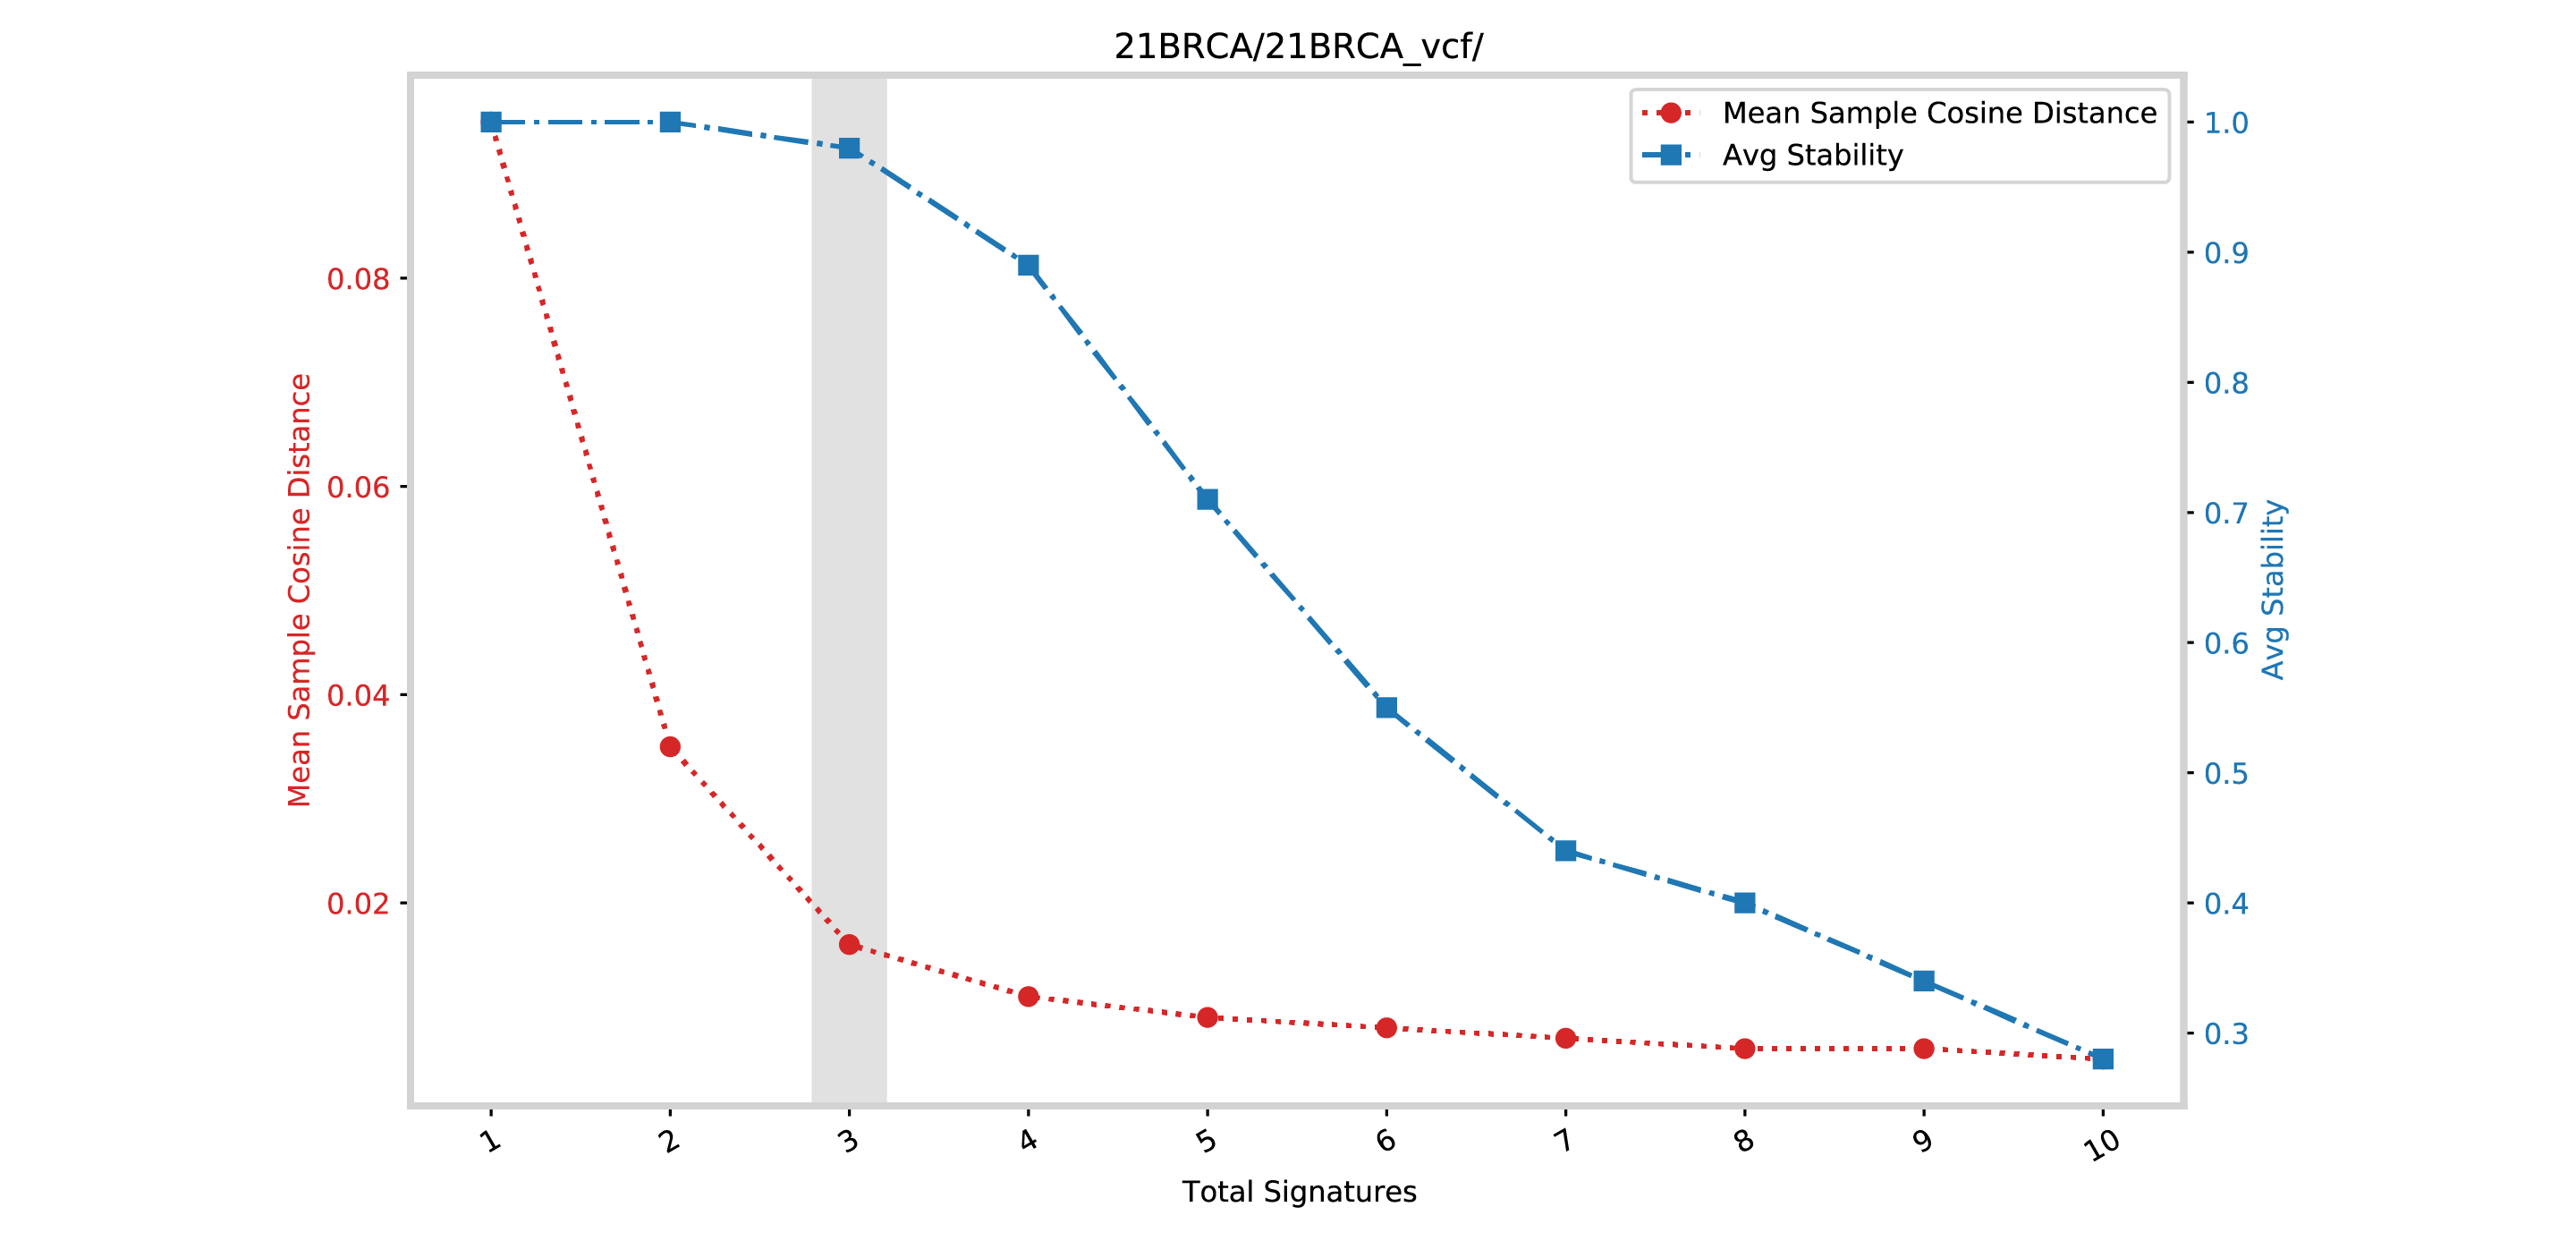
In this example the file is a SBS96_selection_plot.pdf.
This file contains a plot between the mean sample cosine distance and the average stability. The vertical gray bar indicates the optimal number of signatures selected by SigProfilerExtractor.
Samples.txt
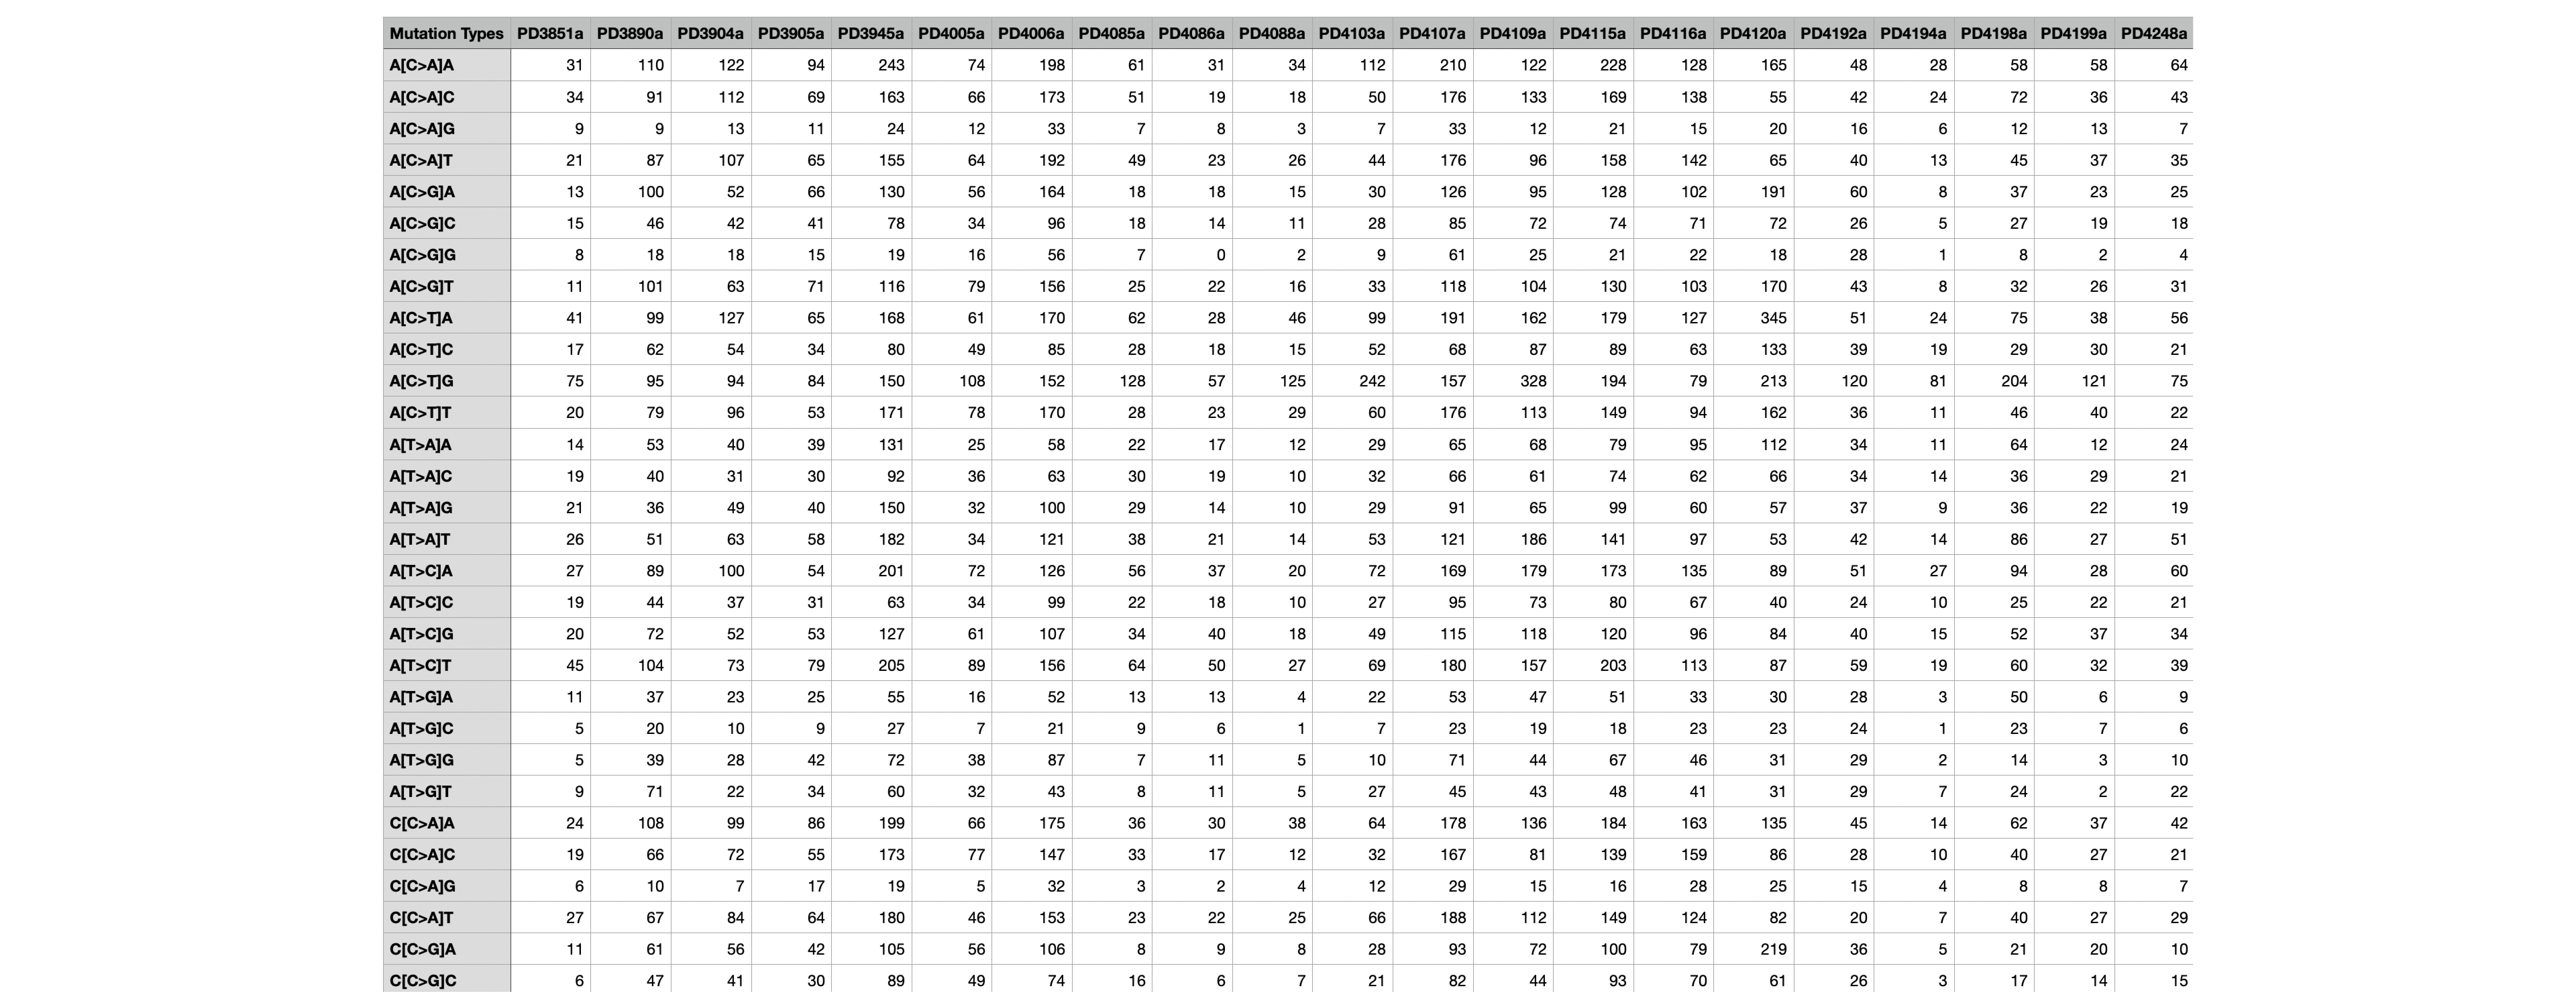
This file contains the matrix of the number of mutations found in each of the samples corresponding to that mutational context. For example, in the file below, each row corresponds to a SBS96 mutational context A[C>A]A and every column corresponds to a sample (PD10010a). Thus the numbers represent the number of mutations found in that context in each sample.