Interactive Dashboard
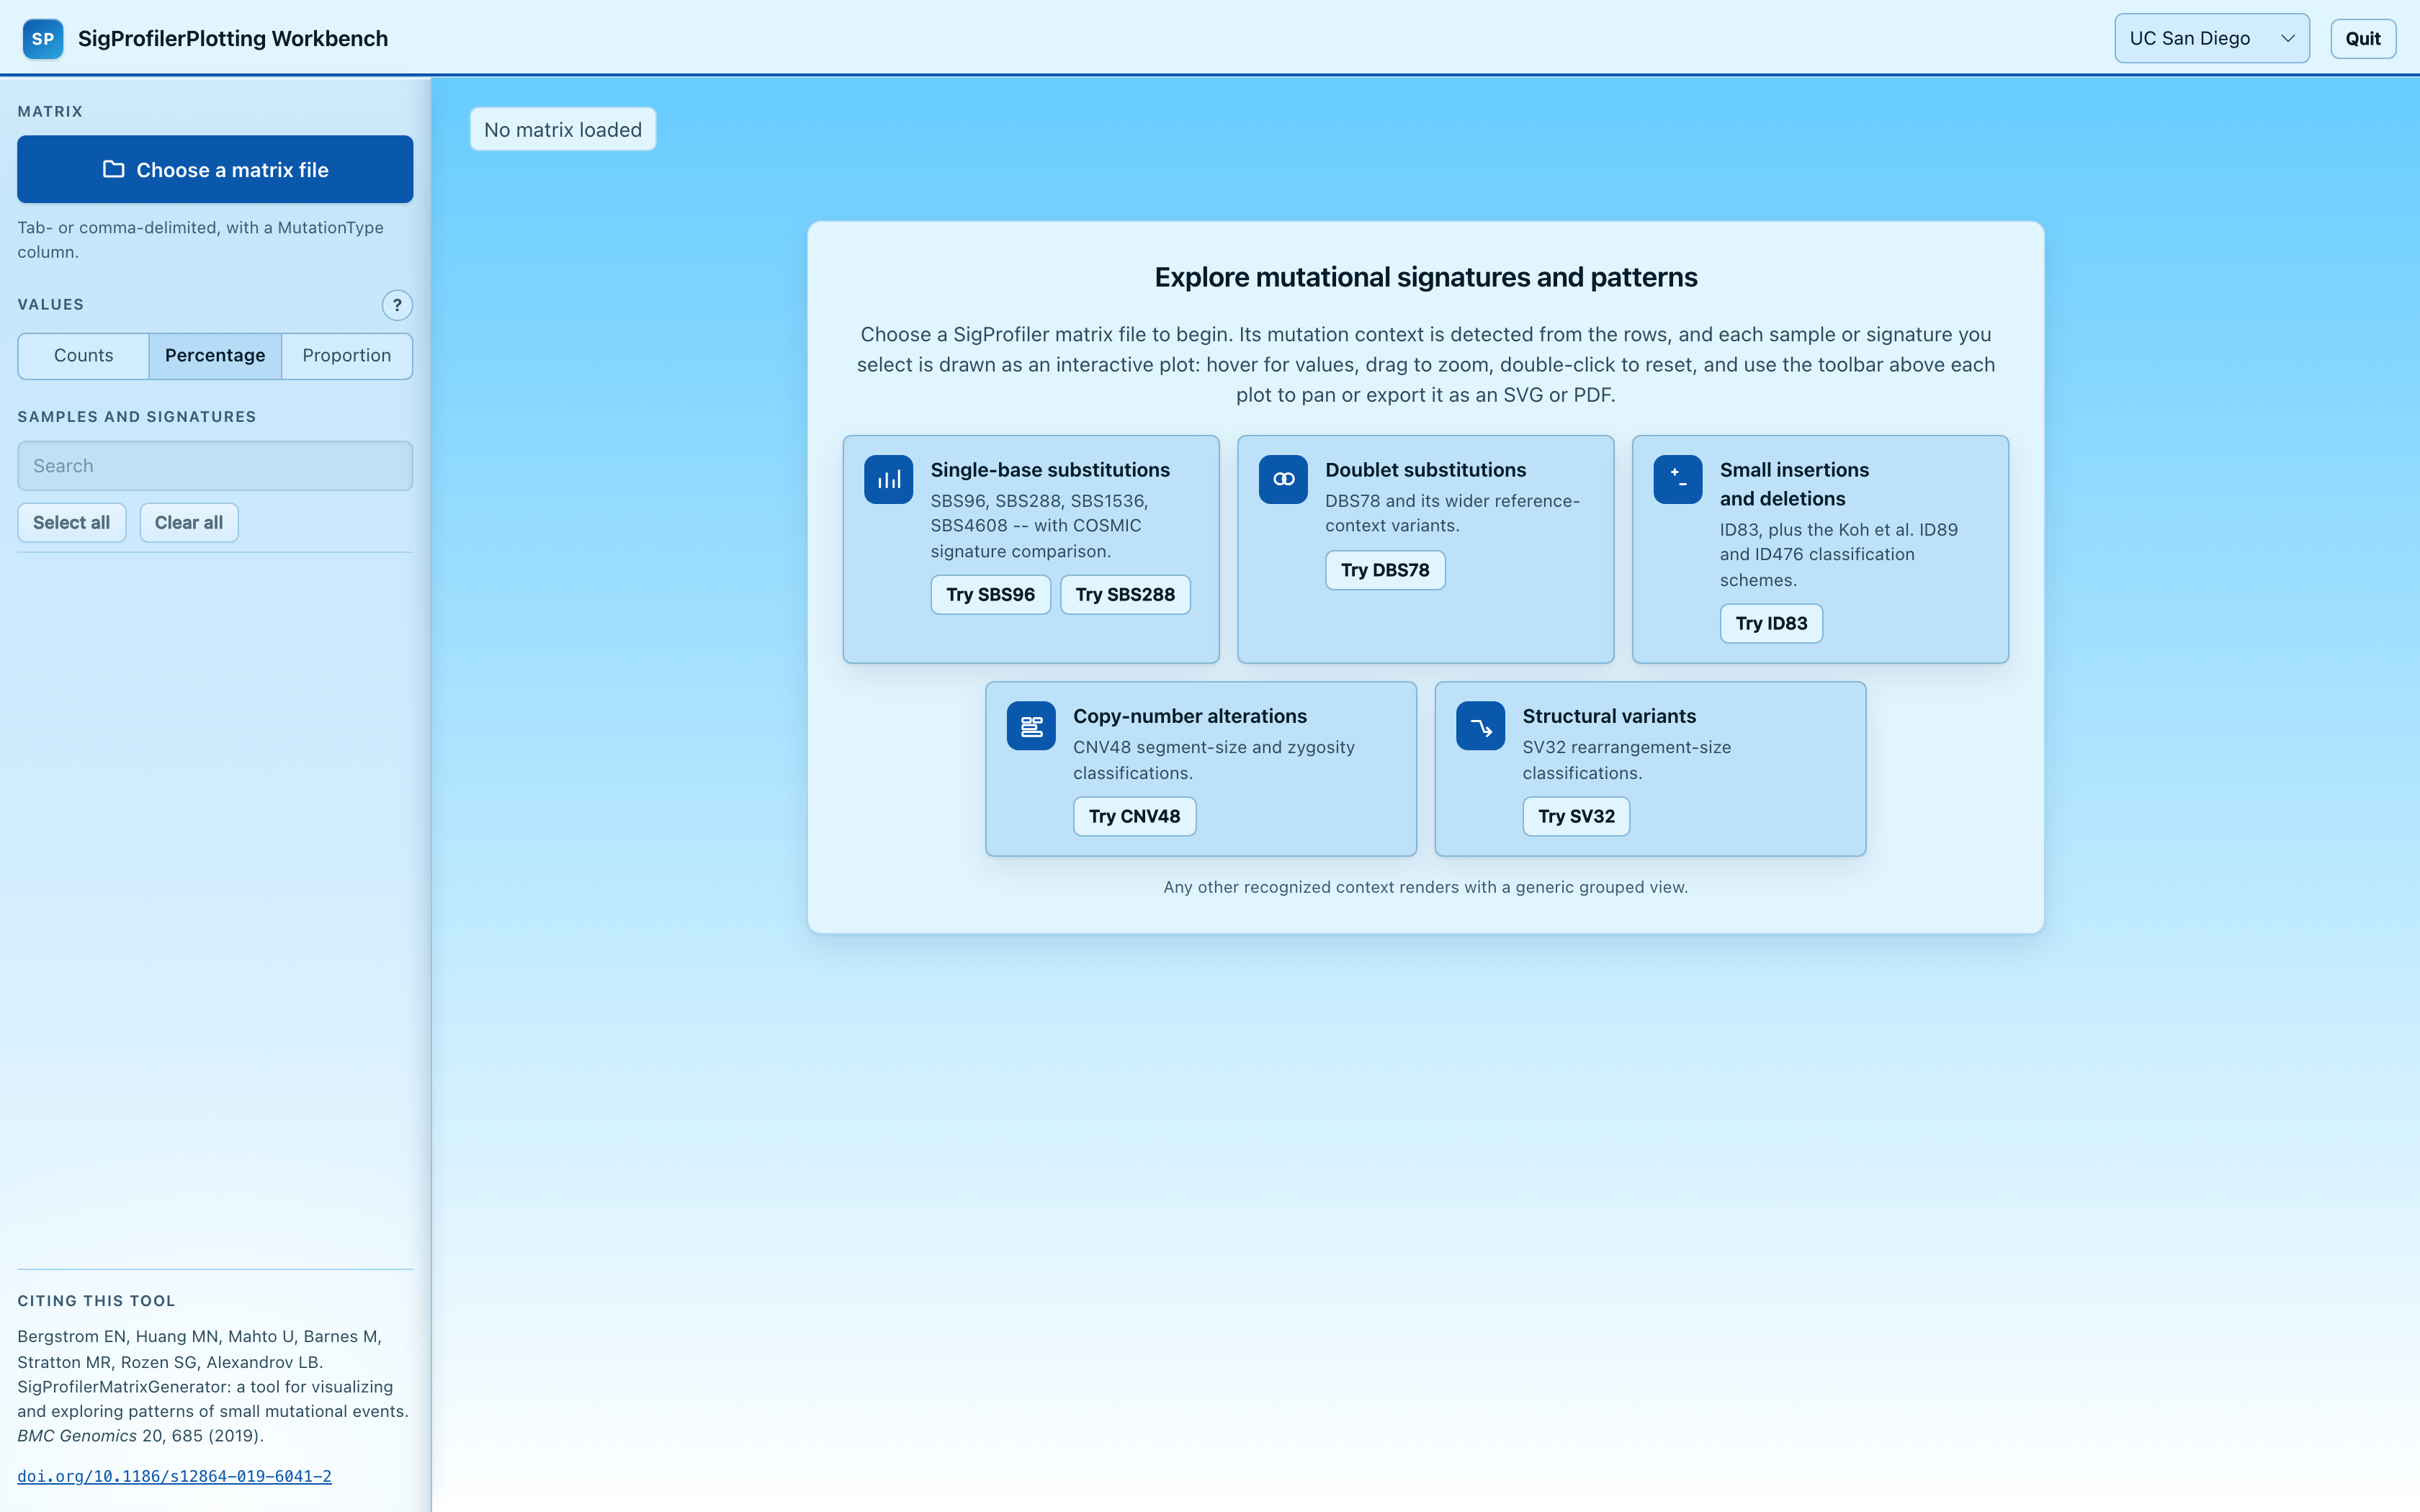
The SigProfilerPlotting Workbench is a local, browser-based dashboard for exploring any supported matrix interactively -- upload a file, pick samples or signatures, and get real Plotly charts with hover, zoom, pan, and image export, without writing any Python.
Note
The dashboard runs entirely on your machine. It binds only to
127.0.0.1 and never sends your data anywhere else. The only way to
load a matrix is through your browser's own file picker -- there is no
server-side file browser and no network upload.
Launching the dashboard
There are two ways to run the dashboard, depending on how you got the code.
In the repository root, double-click launch_dashboard.command in Finder, or run
in a terminal:
Double-click launch_dashboard.bat in the repository root, or run it from a
terminal or PowerShell:
The first time you run a launcher script, it creates an isolated .venv-dashboard
virtual environment next to it and installs the package into it. This can take a minute
or two. Every later launch reuses that environment and starts in a couple of seconds --
you'll see Dependencies already installed; skipping install. printed instead of an
install running.
The launcher installs with uv, which downloads and
installs packages in parallel and is much quicker than pip. It uses the uv already on
your PATH if there is one; otherwise it first adds uv to the dashboard's own
environment. If uv cannot be added or cannot install, the launcher says so and uses pip
instead. To always use pip, for example behind a network that only allows pip's
configured package mirror, set the environment variable
SIGPROFILERPLOTTING_WEB_INSTALLER=pip.
Either way, once the server is ready your default browser opens automatically to the
dashboard, and the terminal prints the URL it's running at (http://127.0.0.1:<port>/)
along with a reminder of how to stop it. If a dashboard is already running, launching
again does not start a second copy -- it prints the existing one's URL and exits.
Command-line options
All of these work with any of the launcher scripts, sigprofilerplotting-web, or
SigProfilerPlotting dashboard (the CLI subcommand, if you prefer invoking it that way):
| Flag | Effect |
|---|---|
--no-launch |
Start the server without opening a browser tab. |
--reinstall |
Force a fresh dependency install even if nothing changed (launcher scripts only -- sigprofilerplotting-web never manages its own environment, so this has no effect there). |
--stop |
Stop a running dashboard server and exit. |
--cosmic-dir PATH |
Enable the COSMIC comparison panel using your own downloaded reference files at PATH (see Comparing against COSMIC signatures). |
--help |
Print usage and exit. |
Stopping the dashboard
Any of these will cleanly shut the server down:
- Click the Quit button in the top-right corner of the dashboard page.
- Press
Ctrl+Cin the terminal the server is running in. - Run the launcher (or
sigprofilerplotting-web) again with--stop, from another terminal.
Using the dashboard
- Click Choose a matrix file (or drag a file onto it) to upload a tab- or
comma-delimited matrix with a mutation-context column and one column per sample or
signature. The first column's header can be named
MutationType,Mutation Types,classification,index,context, or simply left blank -- all of these are accepted, matching the different ways SigProfiler tools andpandasthemselves name (or don't name) that column. Not ready with your own data yet? The home screen groups what the dashboard supports into cards by mutation class, each with a Try<context>button that loads a real example matrix with a single click. Click the logo/title in the top-left corner at any time to come back to this home screen -- it clears whatever matrix is loaded, the same as reloading the page. - The dashboard detects the mutation context automatically from the complete set of row labels -- never from the filename or row count -- and lists every sample/signature column in the sidebar.
- Theme: the picker in the top-right corner switches between four themes (see Themes). Charts always draw on a white background regardless of theme, since they use SigProfiler's own fixed mutation-type colors.
- Choosing what to view:
- Use the search box, Select all, or Clear all to pick which samples/signatures to draw.
- If the matrix has more than 100 samples/signatures, only the first one is selected by default so the page stays responsive immediately -- everyone else is still right there in the list to search for and select.
- Selected items render as you scroll; the dashboard never tries to draw every selected sample up front, so selecting hundreds at once stays responsive.
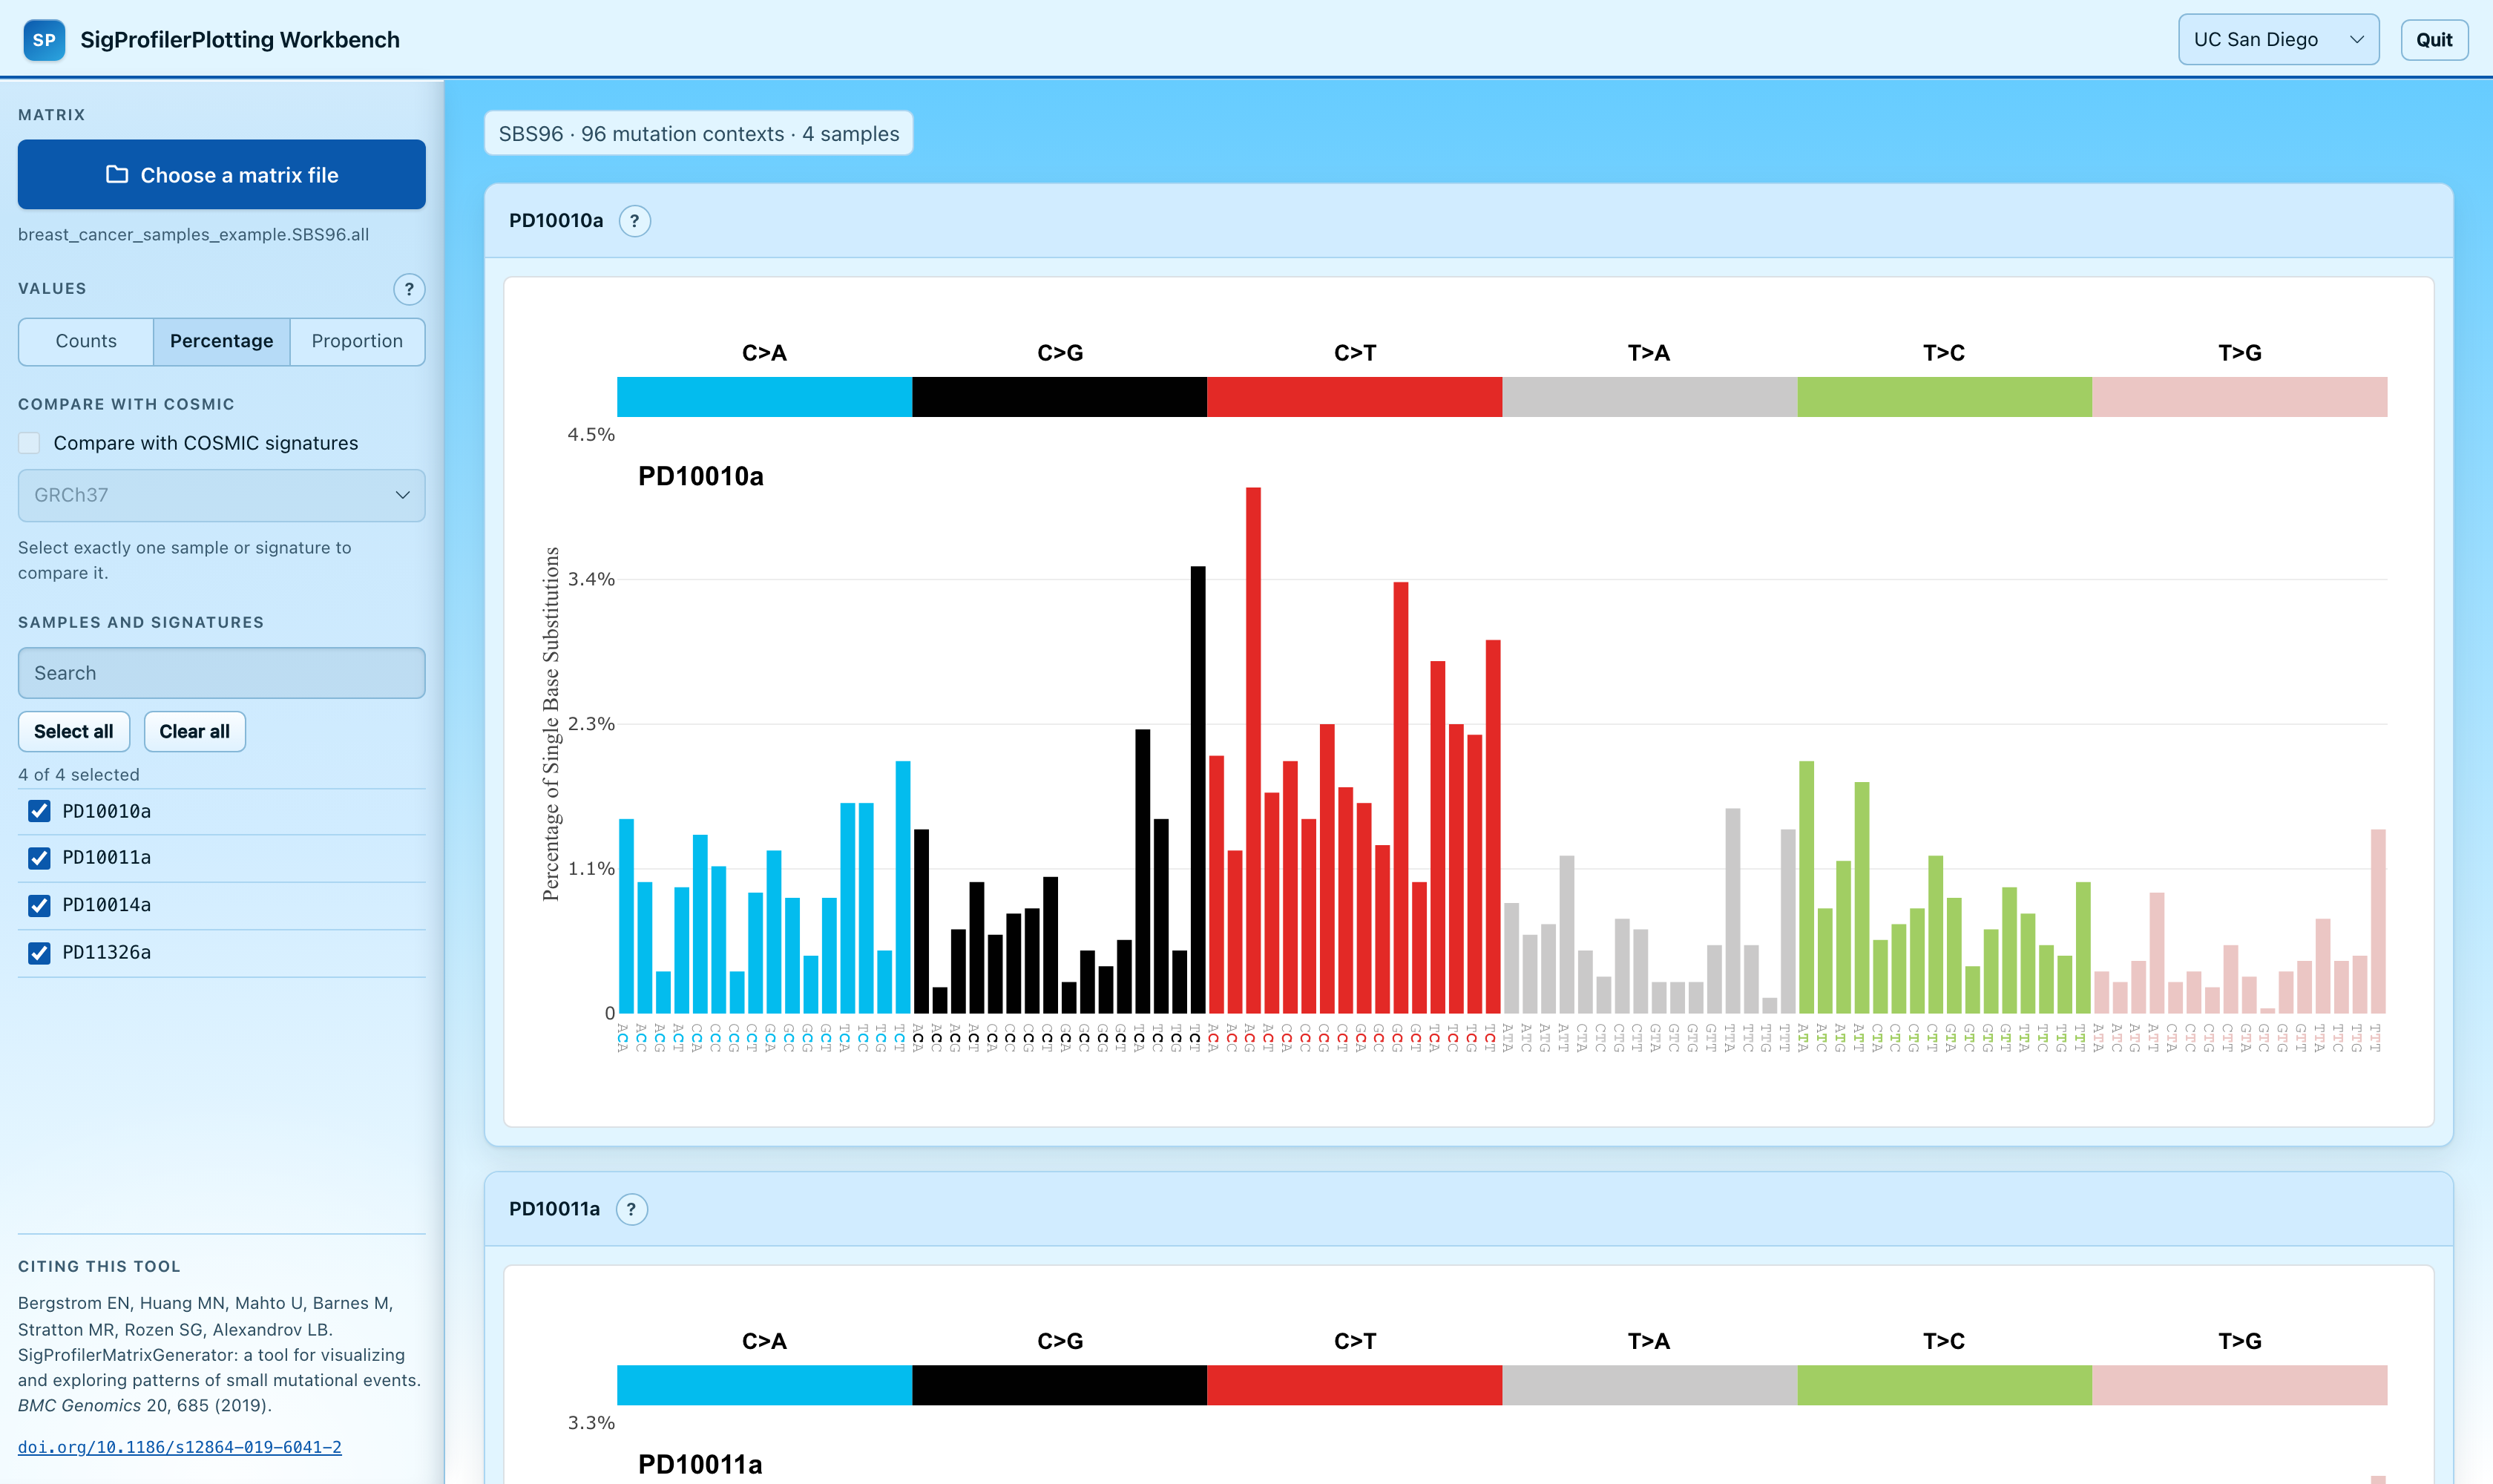
- Values panel: switch between Counts (raw numbers), Percentage (share of the sample's total, 0-100% -- the default), and Proportion (the same share, 0-1) at any time -- every open chart redraws immediately.
- For
SBS4608andSBS1536matrices, an extra panel controls which panels of the multi-part figure are shown (see below). - For
SBS96,SBS288,SBS1536, andSBS4608matrices, selecting exactly one sample or signature enables a Compare with COSMIC panel (see below). - Every chart supports the standard Plotly toolbar: hover for exact values, zoom/pan, reset the view, export as an SVG image (the camera button), and export as a one-page PDF (the disk button next to it).
Comparing against COSMIC signatures
SigProfilerPlotting does not bundle or redistribute COSMIC data
COSMIC's published terms restrict redistributing their signature catalogues, so none are shipped with this package. To use this feature, download your own copy directly from COSMIC (cancer.sanger.ac.uk/signatures) under their license, and point the dashboard at the folder containing it -- the panel stays disabled (with an explanatory hint) until you do.
Launch the dashboard with --cosmic-dir PATH (any of the launcher scripts,
sigprofilerplotting-web, or SigProfilerPlotting dashboard accept this),
or set the SIGPROFILERPLOTTING_COSMIC_DIR environment variable, to a local
folder containing your downloaded COSMIC SBS reference files. Each file must
be named the way COSMIC's own downloads already are --
COSMIC_v<version>_SBS_<build>.txt (for example
COSMIC_v3.4_SBS_GRCh37.txt) -- tab-delimited, with a Type column of
96 trinucleotide-context labels followed by one column per signature.
Recognized <build> values: GRCh37, GRCh38, mm9, mm10, mm39,
rn6, rn7. Only files present in that folder appear as choices in the
dashboard; the folder is re-scanned on every request, so adding or removing
a file takes effect without restarting the server.
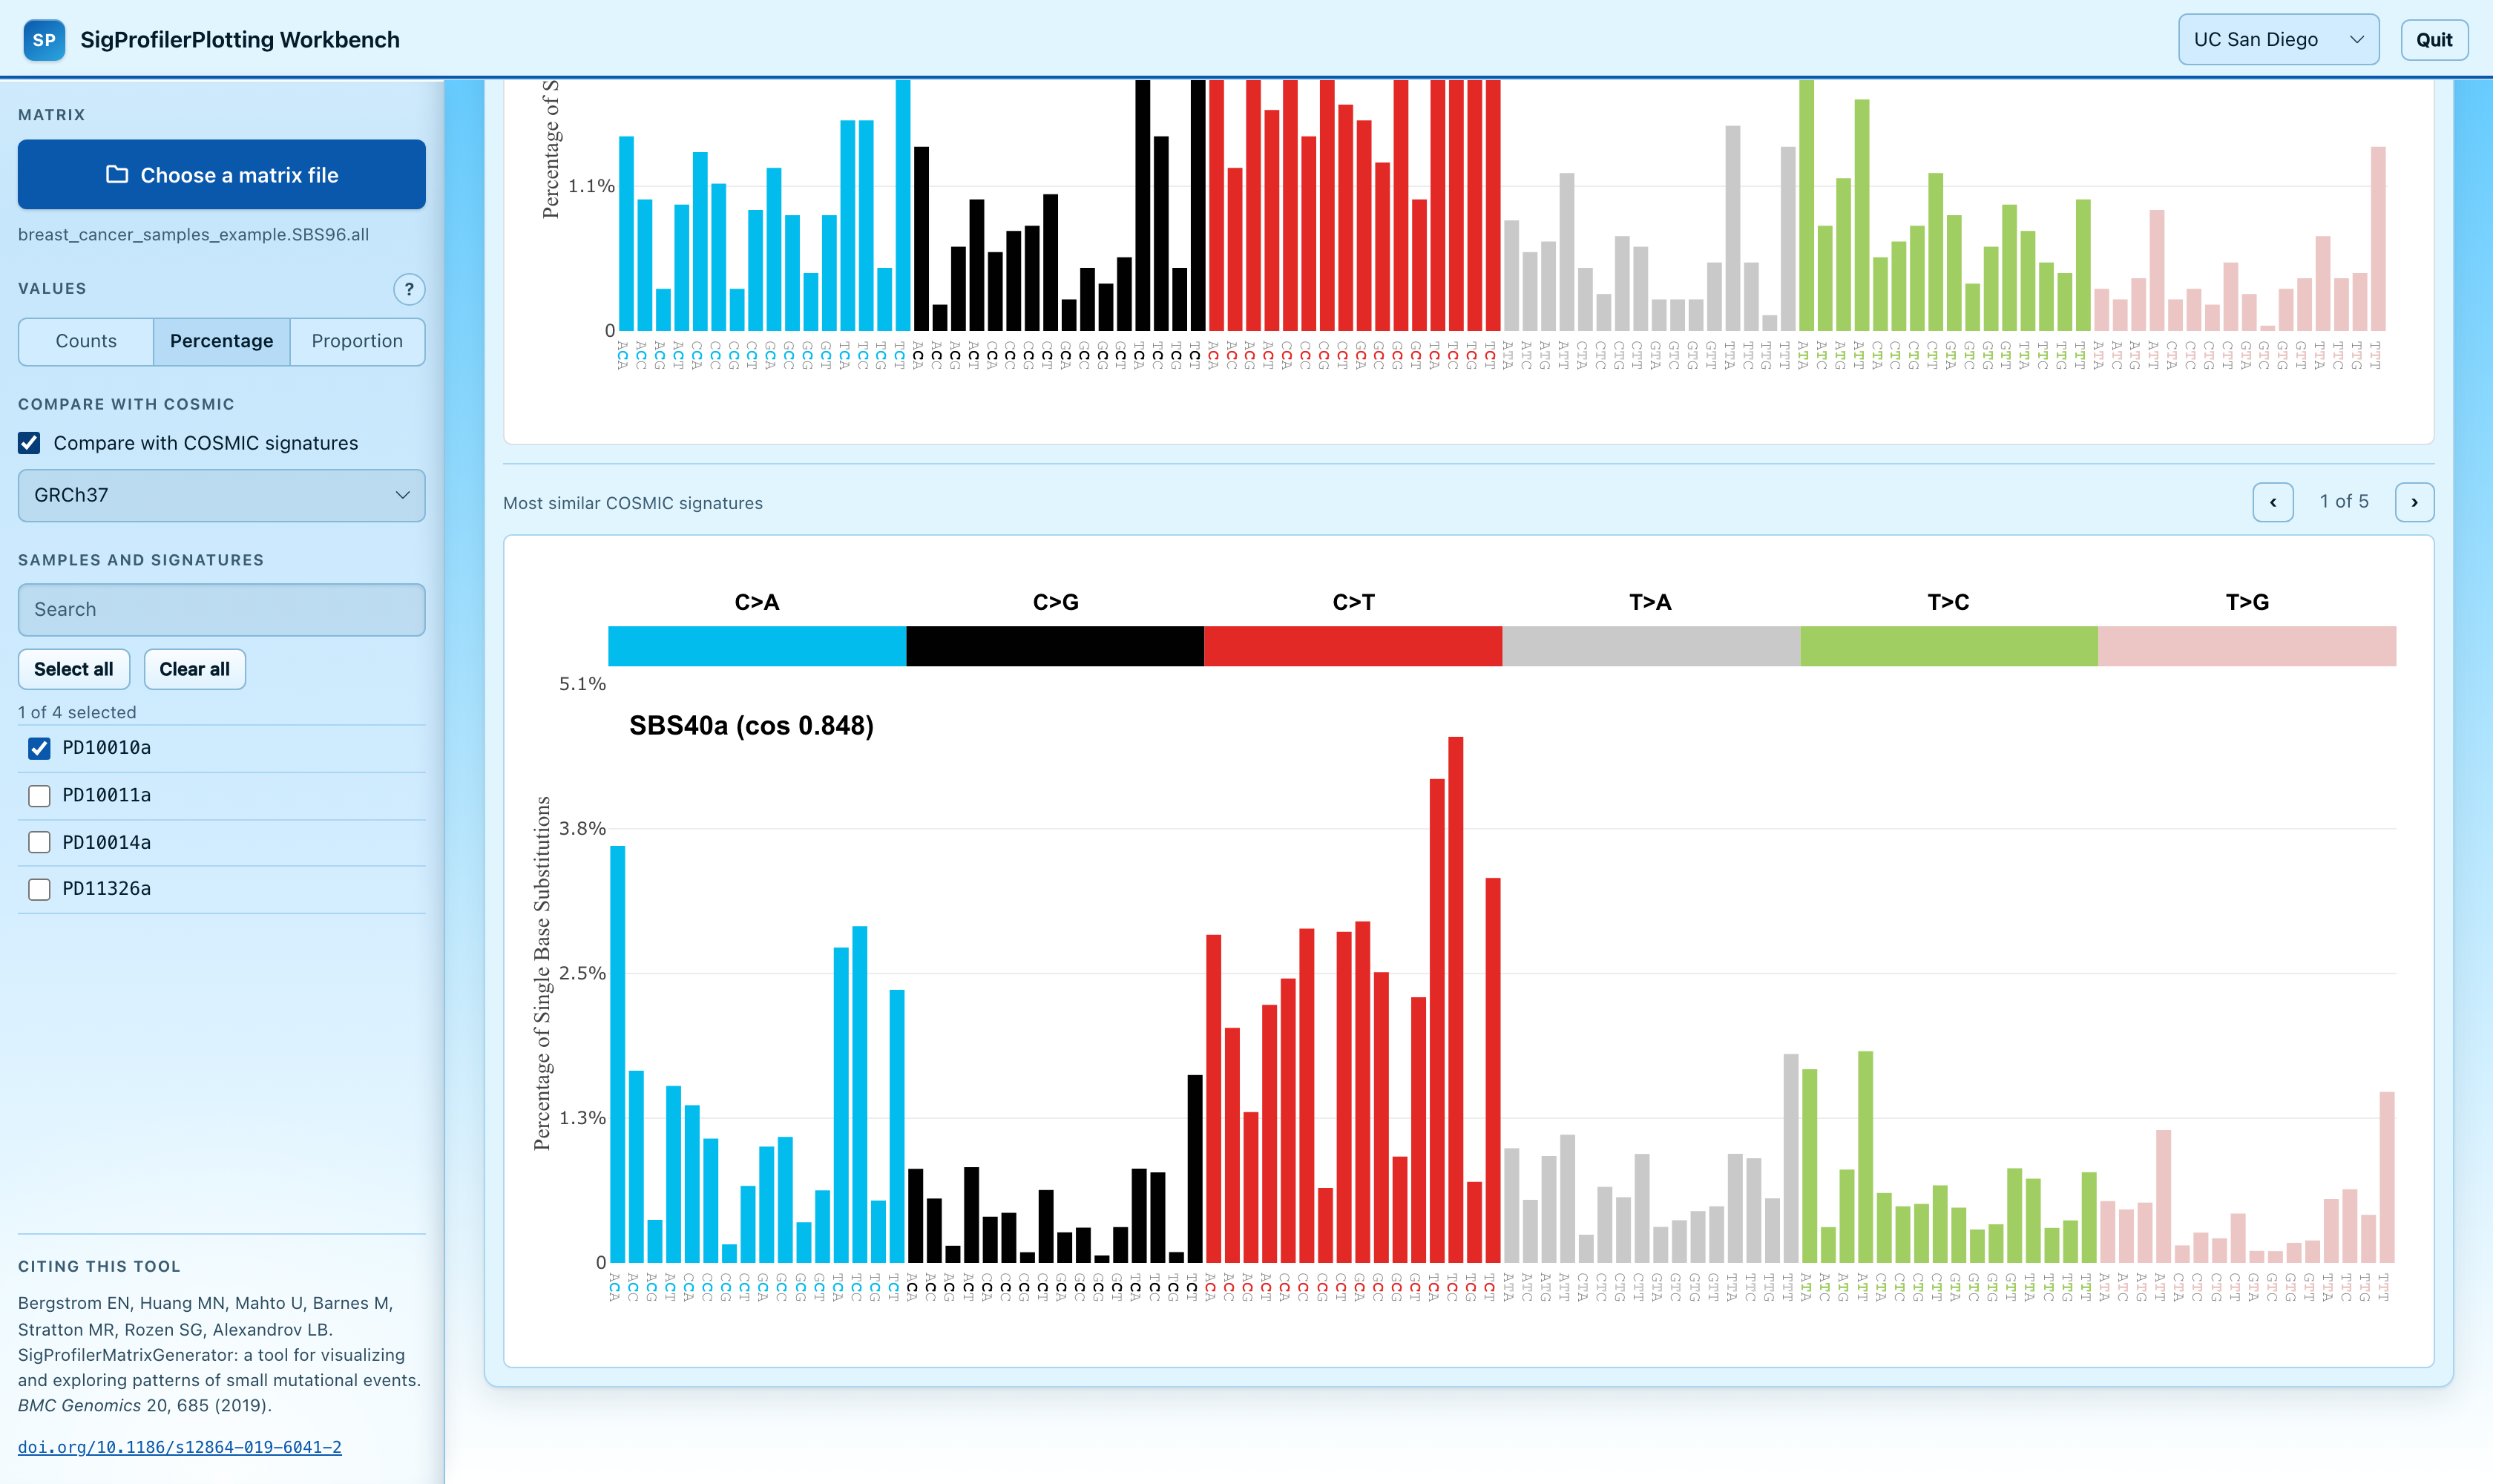
With a catalogue directory configured, an SBS96, SBS288, SBS1536, or
SBS4608 matrix loaded, and exactly one sample or signature selected, check
Compare with COSMIC signatures in the sidebar and pick a genome build --
each option's tooltip shows the exact file version, path, and SHA-256
checksum it will compare against. The plot splits into two panels:
- Upper panel: your selected sample/signature, unchanged -- including
SBS4608/SBS1536's own multi-part view. - Lower panel: the 5 COSMIC signatures from that build whose spectrum is most similar to it, each drawn full size (the same size as the upper panel) and labeled with its cosine similarity score. One is shown at a time, highest-similarity first; scroll the panel, or use the ‹/› buttons, to move through the rest.
SBS288 (strand-tagged trinucleotide), SBS1536 (pentanucleotide), and
SBS4608 (strand-tagged pentanucleotide) are compared by first collapsing
them down to the 96 trinucleotide contexts COSMIC's own catalogue uses --
summing out the strand tag and/or the wider flanking bases. An SBS96
matrix needs no collapsing.
The comparison is scale-invariant -- it gives the same ranking regardless of whether the Values panel is set to Counts, Percentage, or Proportion (the comparison panels themselves follow Percentage/Proportion, since a reference signature has no raw count of its own; Counts falls back to Proportion there). It deactivates automatically (and the checkbox unchecks itself) as soon as more than one sample/signature is selected, since "most similar to what" stops being well-defined at that point.
Supported contexts
The dashboard has a purpose-built, COSMIC-style view for:
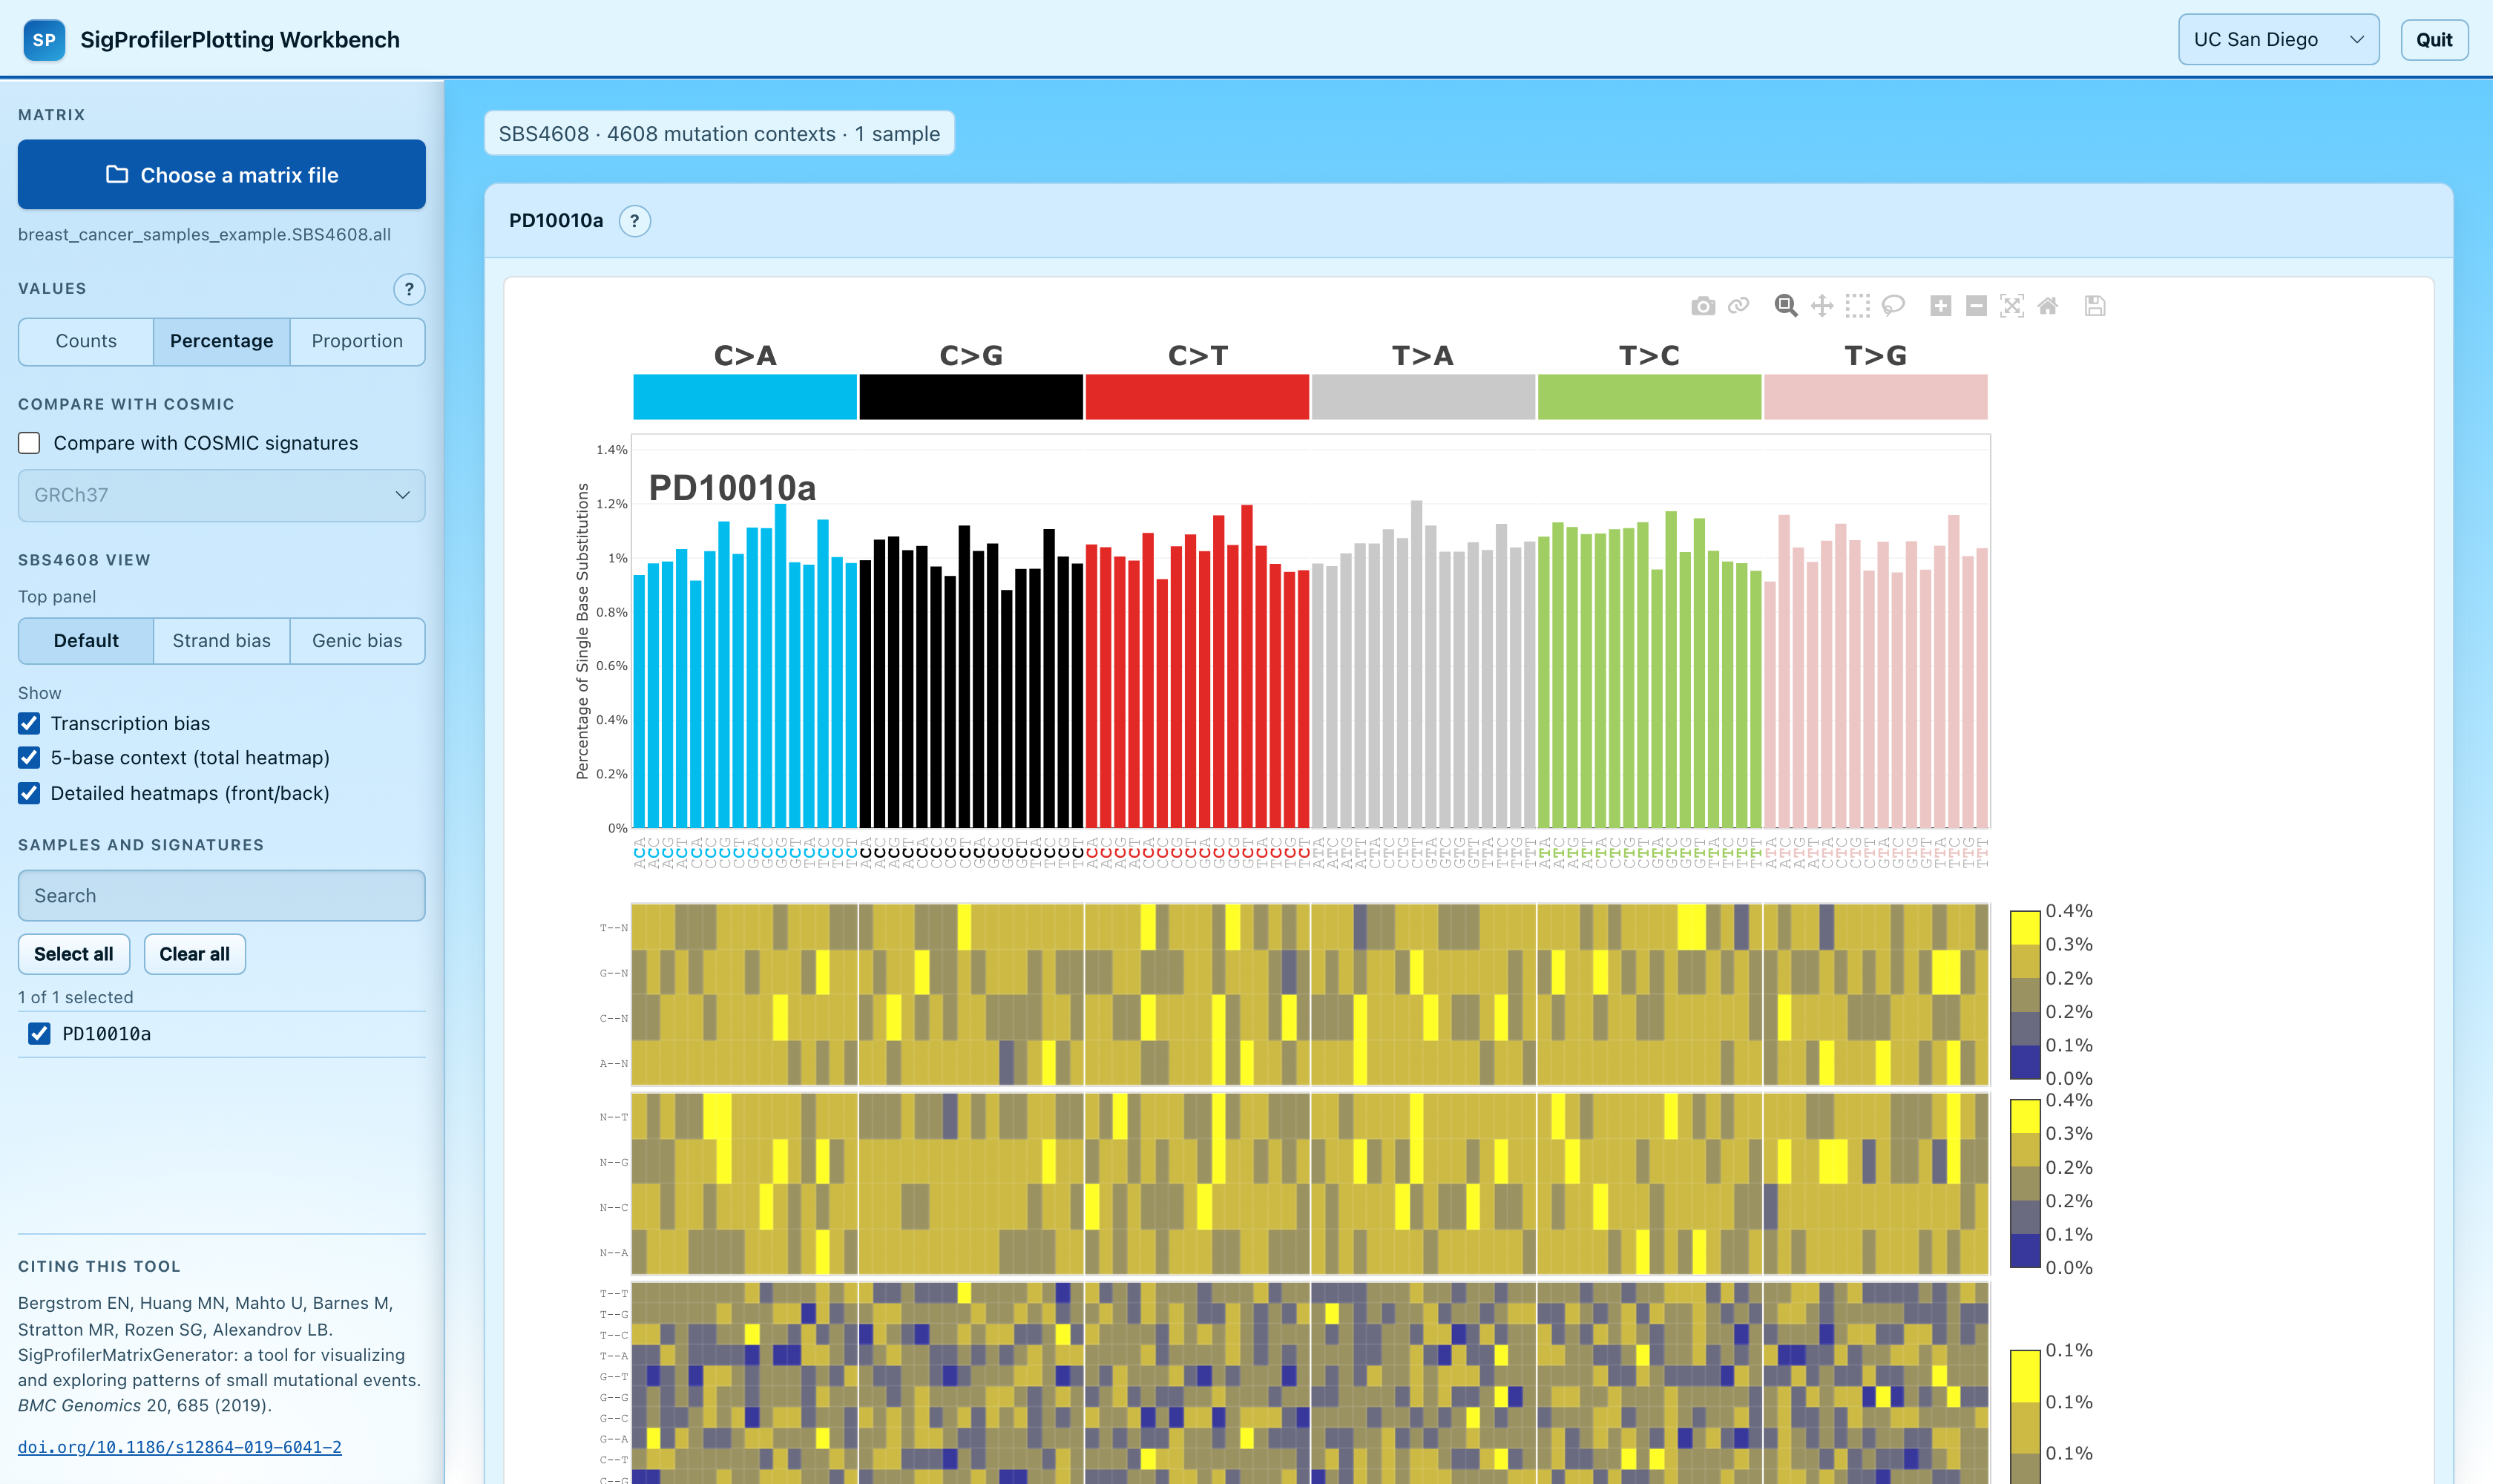
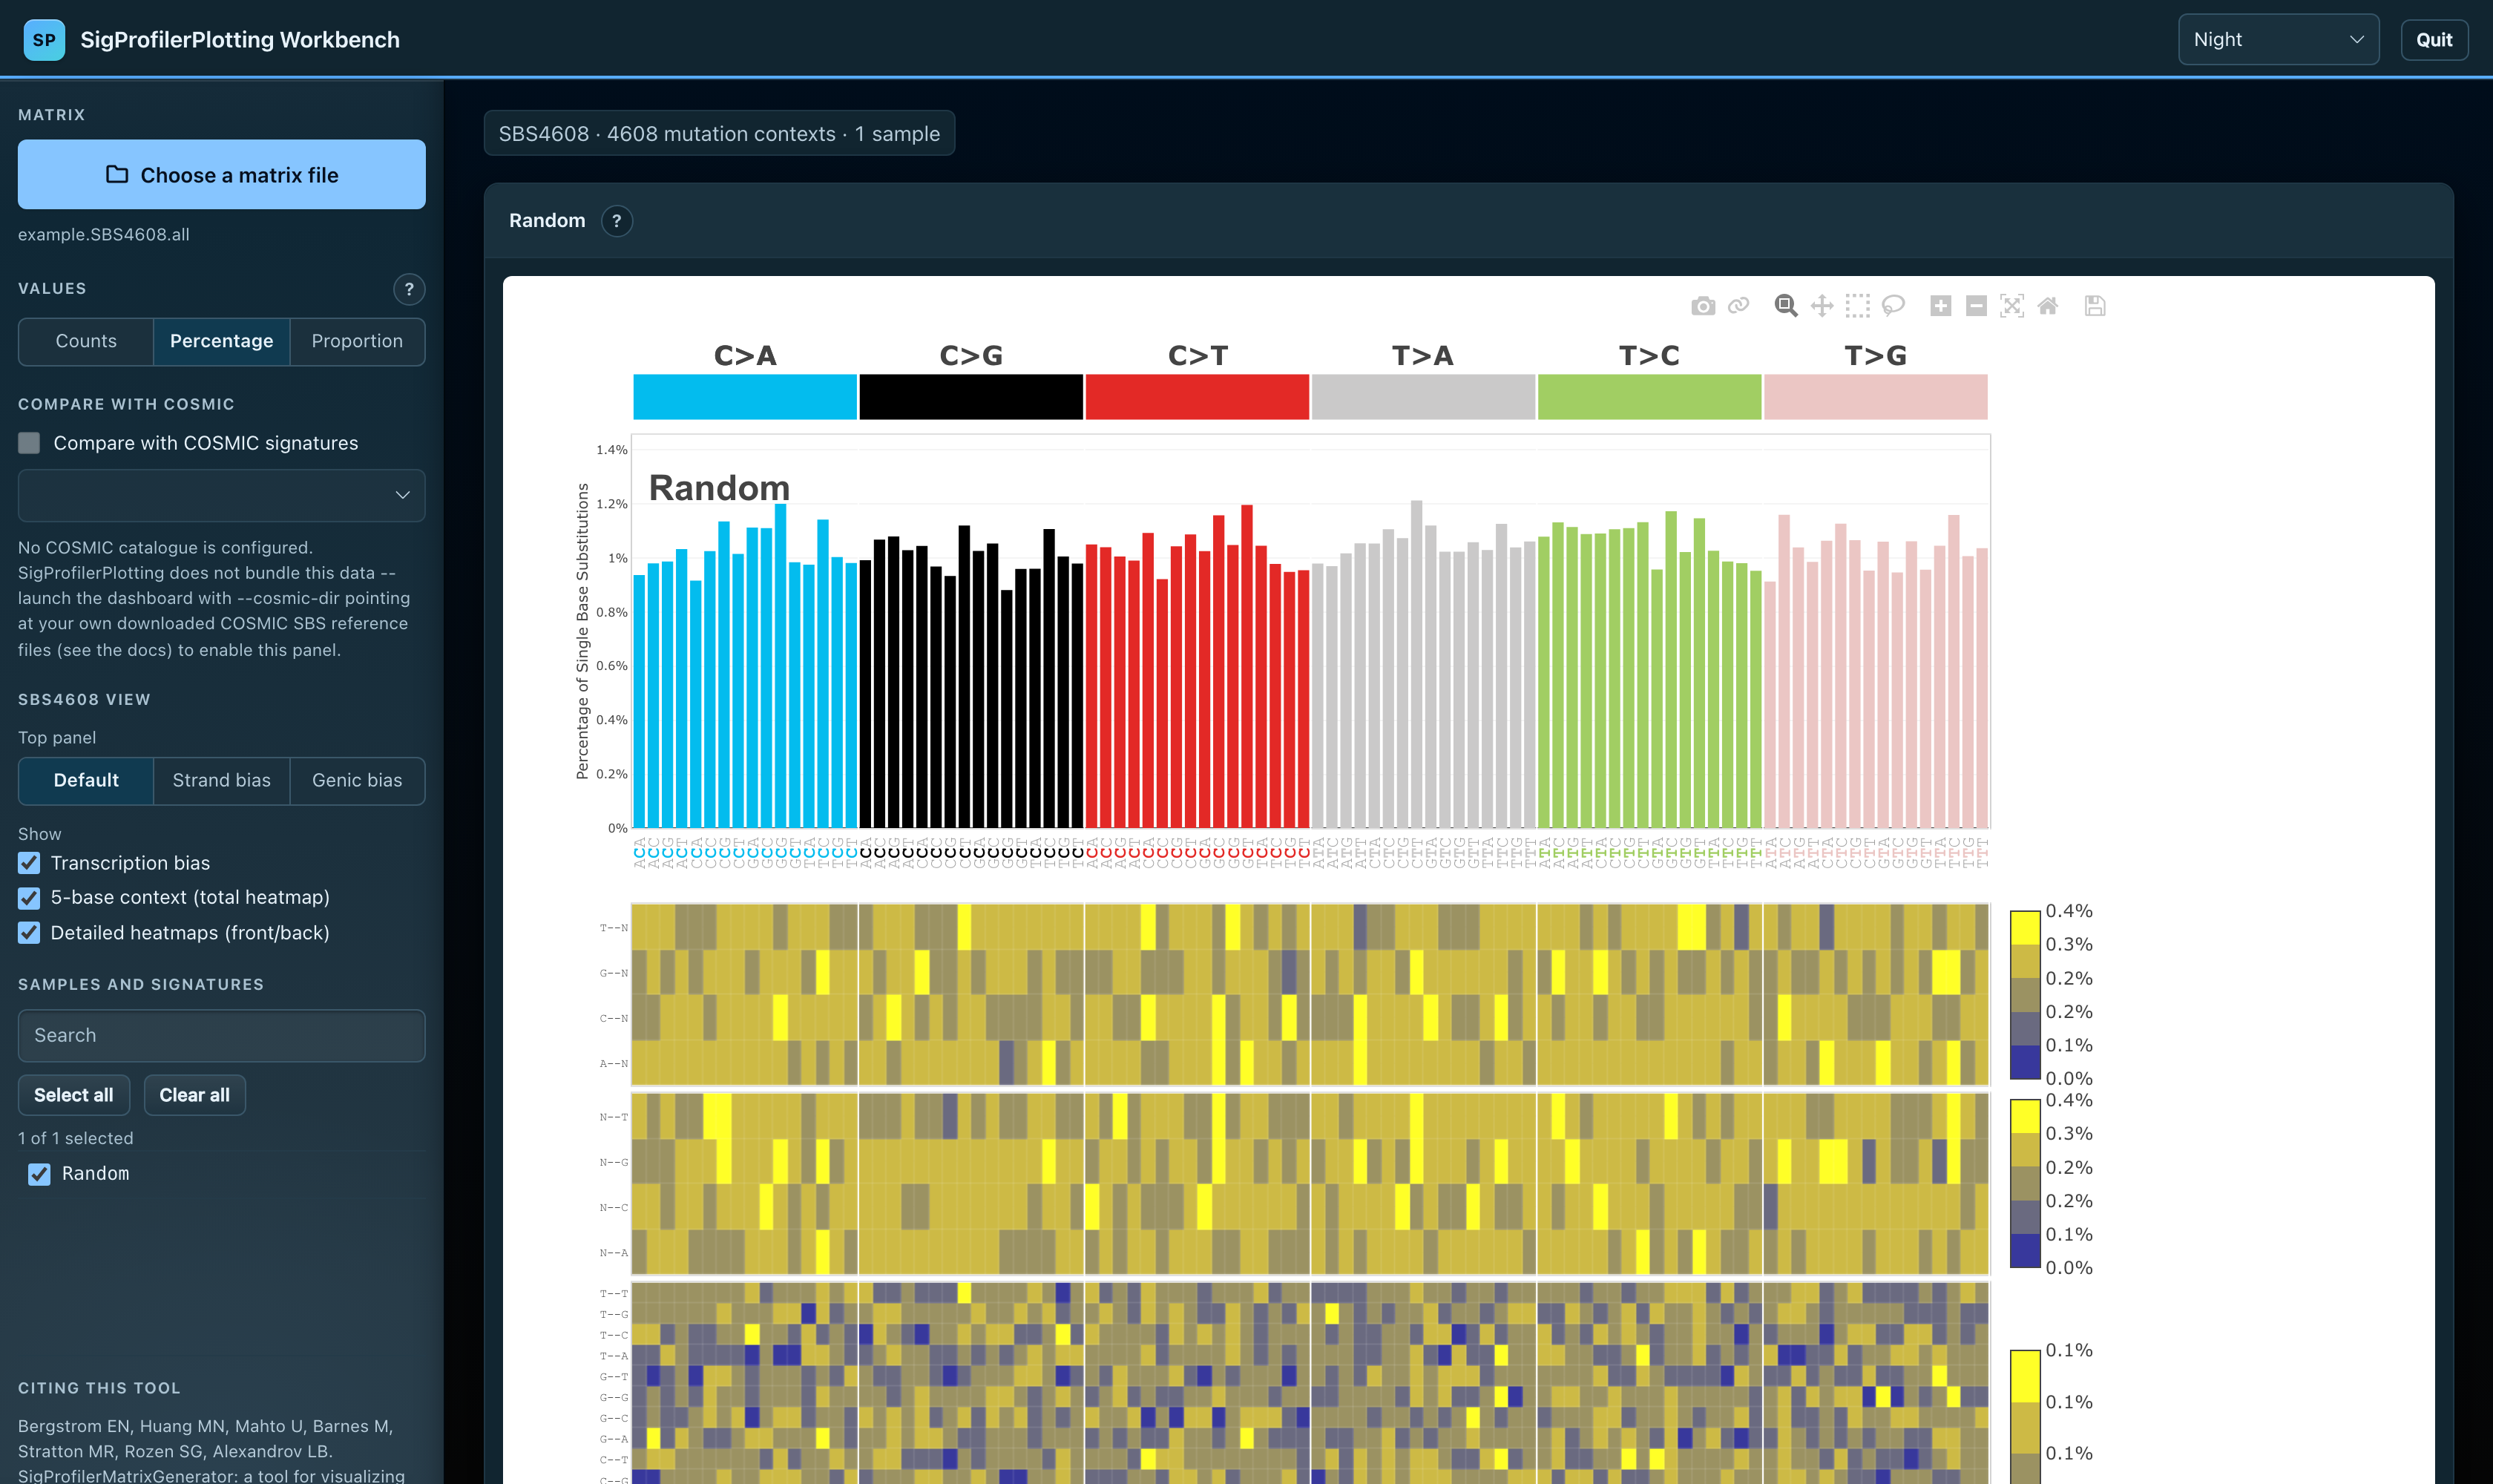
SBS96-- the classic colored substitution-type header bands and trinucleotide-colored axis ticks.SBS4608-- the same multi-panel view asplotInteractive: a 96-bin bar chart, a 5-base context ("total") heatmap, front/back detailed heatmaps, and a transcription-bias panel (Transcribed/Untranscribed, Genic/Intergenic). A Top panel control switches the main chart between Default, Strand bias, and Genic bias; three Show checkboxes toggle the Transcription bias, 5-base context (total heatmap), and Detailed heatmaps (front/back) sections independently -- hiding a section reclaims its space instead of leaving it blank.SBS1536-- the same bar chart, 5-base context heatmap, and detailed front/back heatmaps asSBS4608's default view, since a 1536-row matrix is exactly whatSBS4608data becomes once its strand tag is summed away. There is no strand information in anSBS1536matrix, so the Top panel variants and the Transcription bias section do not apply and are not shown.SBS288,DBS78,ID83,ID89,ID476,CNV48, andSV32-- each with its own grouped, correctly colored and labeled layout.ID89andID476are the Koh et al. indel classification schemes -- see Plotting ID89/ID476.
Any other context SigProfilerPlotting recognizes -- SBS1536's sibling
sizes SBS6, SBS18, SBS24, SBS384, SBS6144, the other DBS/ID
sizes (DBS150, DBS186, DBS1248, DBS2400, DBS2976, ID28, ID96,
ID332, ID415, ID8628), and so on -- is never rejected; it renders with
a generic grouped bar view instead of a specialized one.
Themes
The menu in the top bar switches between four themes -- UC San Diego (the default), UAlbany, SigProfilerSuite, and Night -- shared with the other SigProfiler Suite workbenches. Your choice is remembered in the browser for next time. Charts always draw on a white background regardless of theme, since they use SigProfiler's own fixed mutation-type colors.
Common input errors
The dashboard reports the same kind of actionable, specific errors as the plotting functions: duplicate or unexpected mutation-context rows, malformed or non-numeric cells, negative values, and duplicate or empty column names are all rejected with a message naming the exact row or column at fault.
Troubleshooting
- The browser didn't open: open the URL printed in the terminal manually
(
http://127.0.0.1:<port>/). - "Dashboard is already running" / it won't start a second copy: this is
expected -- the launcher refuses to start a second server rather than
silently orphaning the first. Run it with
--stopfirst if you actually want to restart it. - Uploading a large matrix seems slow / shows nothing for a while: very wide matrices (many thousands of samples) take real time to parse and upload -- this is normal; the upload has succeeded once the sample list populates. There is no progress bar for the upload itself yet. The dashboard streams the upload straight to disk and reads each sample lazily on demand rather than holding the whole matrix in memory, so memory use stays flat regardless of how many samples it has -- a real-world test matrix with 10,000 SBS4608 columns (134 MB) added only about 12 MB of memory to upload and parse, and a single sample render added almost none on top of that.
- "The upload exceeds the N-byte limit": uploads are capped (4 GiB by
default) as a sanity check against a truly unreasonable file, not a
tight budget. Raise it with the
SIGPROFILERPLOTTING_MAX_UPLOAD_BYTESenvironment variable (in bytes) before launching if you genuinely need to go higher. - Changes to the package aren't showing up: run the launcher with
--reinstallto force a fresh dependency install (repository launcher scripts only); if you're running the server from a previous launch, stop it (--stop) and start it again -- code changes require a restart.